Drug Discovery Process
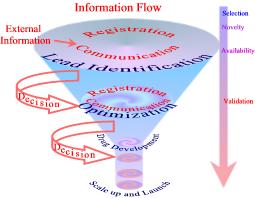
In the following we will develop pictures and graphs that should allow the reader to find its position and function in chemical research. These pictures should help to understand
- Workflow
- Functions
- Information flow
- Business rocesses
- Business rules
- Data flow
- Technology
in drug discovery, and in chemical research in general. If we did the job well, you will understand where information technology is absolutely critical to the success of finding new drugs, and which solutions are available.
|
Workflow - |
||
 |
 |
 |
| click on the title to get a blow-up |
The workflow diagram gives you an entry to products that are used in this area. We can only cover a small portion of the available solutions. MDL and its customer have produced in the last 20 years a wealth of applications. A good source for more detailed information is MDL's Newsmagazine "Molecular Connection" and the CDs of the last User' Group Meeting. These are customized applications build on the ISIS technology. Send us an email, and we will send you articles about special applications.
The green arrows in the workflow describe the functions or activities that need to be done to narrow the choice of candidates. This is described in the picture "Drug Discovery Functions". These arrows also represent the flow of information that moves from one phase to the next required to make decisions. Typical softwares which help in the decision making process are clustering applications, PASS, and SAR tables.
|
|
|
|